Consider a practice like this: Dr. Rina Delgado runs a single-location office in Bakersfield, California, and for a year she paid for visibility every month without ever asking what came back. The reports looked healthy. Forty-one new patient calls in a good month, impressions climbing, a follower count she could screenshot for her study club. Then she pulled her own production report and found the patients from those calls averaged a fraction of what her existing base produced in a first year. Nothing had failed. Nothing had worked either. A pattern that appears across the data: the practices that feel busiest are often the furthest from knowing what their visibility is actually worth. If you have never checked what this looks like in your own practice, you are standing where they stood.
Every invoice you sign for patient discovery asks the same question back at you, and most practices never answer it: did that money produce patients, or did it produce activity? Dental marketing ROI is not a mystery that requires an agency dashboard to solve. It is arithmetic, and you already own every input, sitting in your practice management software under production, collections, new patient exams, and case acceptance. The difficulty is not finding the number. The difficulty is that three completely different numbers get treated as if they were the same one, and only the third of them pays your associate, covers your note, and shows up in what you take home.
What are you actually paying for when the invoice arrives?
You are not buying visibility. You are buying a chance at a chair hour. That distinction sounds academic until you price it out. An hour of hygiene, an hour of restorative, and an hour of implant surgery are three different businesses sharing one address, and the money you spend on being found buys into whichever one your positioning points at. When a practice cannot say which chair hour its visibility is filling, it defaults to measuring the cheapest thing in the chain: the click, the call, the form submission. Those are inputs. Your profit and loss statement has no line for inputs. It has production, collections, overhead, and what is left over for you. The only honest version of the question is what a dollar returned in production, net of the time your team spent chasing it. Ask that, and half the reports you receive stop being relevant. Ask it twice, and you will notice something worse: those reports were never built to answer it. They were built to demonstrate effort. Your practice does not pay its note with effort.
Why is "we generated 40 leads" not an answer?
Forty leads is a description of activity. It tells you nothing about whether those forty people scheduled, whether they arrived, whether they accepted anything beyond an exam and two bitewings, or whether your front desk burned nine hours returning calls that went nowhere. Every one of those is a real cost. Staff time spent qualifying poor-fit inquiries is the most expensive and least visible line in the entire exercise, because it never appears on a bill. It appears as a team that feels stretched thin and a schedule that still has holes at 3pm on Thursday.
The number that matters sits two steps further down: of those forty, how many became treated patients, and what did they produce in ninety days? A practice generating fifteen inquiries that convert into eight treatment plans is outperforming a practice generating forty that convert into five, at any price point, in any market. Your practice does not need more volume at the top of the funnel. It needs to know what the top is made of before it agrees to buy more of it.
What separates reach, response, and revenue in your practice?
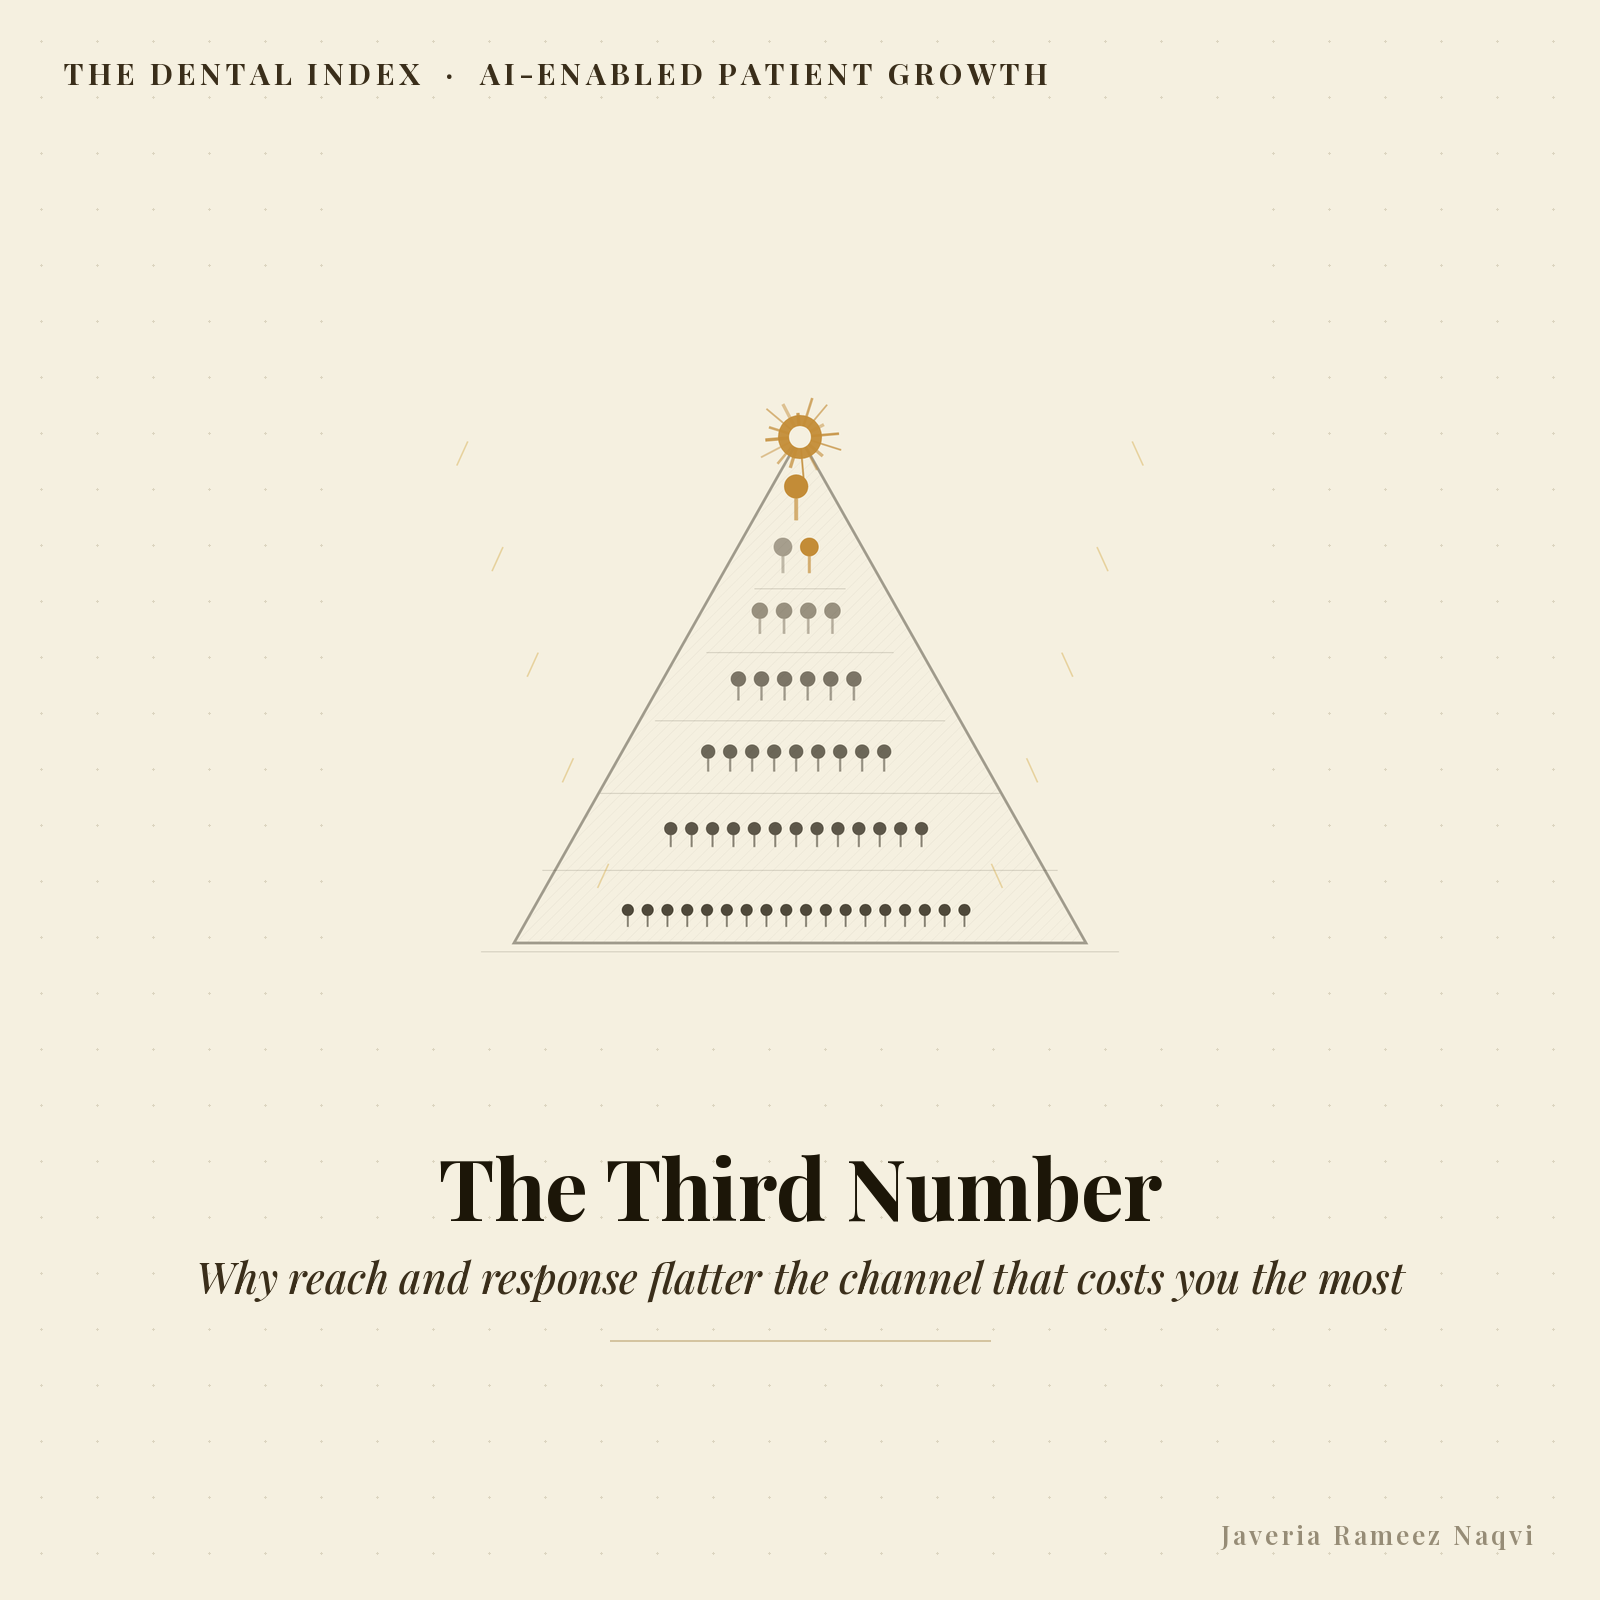
Three layers get collapsed into one conversation, and the collapse is exactly where the money hides.
- Reach is who saw you: impressions, followers, map views, the graph that goes up and to the right. It costs money and proves nothing by itself. Reach is a hypothesis, not a result.
- Response is who acted: calls, forms, direction requests, chat sessions. This is the layer nearly every report lives in, because it is the last thing an outside platform can observe. Your practice can look excellent here and still be losing money every month.
- Revenue is who booked, arrived, accepted, and paid. This layer lives entirely inside your software, which is precisely why outside reporting stops one layer short of it.
A channel is only accountable at the third layer. Everything above it is a leading indicator you can be confidently wrong about for six months. Separating the three gives you something immediately useful: you can see whether your problem is that nobody finds you, that people find you and do not act, or that people act and the practice cannot convert them. Three different problems, three different price tags, and spending against the wrong one is the most common way a solo owner loses a year.
How do you calculate production per dollar instead of leads per dollar?
Take a ninety day window that has already closed. Pull every new patient who entered through the channel you are testing. Sum their completed production, not their presented treatment plans, across that window. Divide by everything the channel cost you: the retainer, the ad spend, and an honest estimate of staff hours at their loaded rate. That figure, production per dollar, is your answer, and it fits on a sticky note.
Then run it a second way to see what you are really building. Divide by collections rather than production, because a $5,500 case that is sixty percent collected is not a $5,500 case. The gap between those two figures is your write-off and adjustment story, and it belongs inside the return calculation rather than in a separate conversation with your accountant in January.
Now run the same math on your existing patient base and on referrals. You will usually find that recall and word of mouth produce more per dollar than anything purchasable. That is not a reason to stop buying. It is a reason to know what you are buying at the margin, and to price that difference honestly before you renew anything.
Can a channel win on response and still lose you money?
Constantly, and it is the single most expensive blind spot in solo ownership. Volume channels attract price-first shoppers, and price-first shoppers convert into exams, cleanings, and single-surface work. High-intent discovery attracts patients who have already decided they want something done and are now choosing who does it. The economics are not close. Implant cases average $4,500 and case volume is growing 8.5% a year. Ortho averages $5,500 and grows at 5.1%. Cosmetic averages $3,800 and grows at 6.8%. Your practice can fill an identical number of chairs from either source and close the quarter with a production difference larger than an associate's salary.
This is why response-level reporting flatters the wrong channel so reliably. Forty low-intent inquiries look better on a dashboard than nine high-intent ones, and no dashboard is built to tell you otherwise. Nine implant consultations at that average produce more than forty exams will, and they consume less front desk labour to schedule and confirm. When you finally measure at the revenue layer, the ranking of your channels frequently inverts. Most owners have never witnessed that inversion, because nobody ever ran the number.
Which numbers in your own software answer this question?
You already own the data. It is not packaged well, but it is sitting there.
- New patient source field, captured at the moment of scheduling rather than reconstructed from memory in April. If this is blank or left on a default, every calculation downstream of it is a guess wearing a suit.
- First visit production and ninety day production per new patient, which tells you whether a channel is delivering exams or delivering cases.
- Case acceptance rate by source, because a channel that delivers patients who decline treatment is delivering appointments, not revenue.
- Collections against production by source, which separates the patients who sign from the patients who pay.
- Show rate, the quietest number in the practice. Broken appointments from low-commitment inquiries quietly destroy returns that look perfectly healthy on paper.
Five fields. No dashboard, no new software, no consultant. If your team cannot populate the first one reliably, fix that before renewing a single contract, because until it is clean you are making budget decisions from feel. Your practice can survive a bad quarter. It cannot survive three years of not knowing which quarter was the bad one.
What does your case mix do to the same spend?
Two practices spend identically on visibility and finish the year owning different businesses, because the return on a dollar is set by what that dollar is pointed at. If your positioning says general dentistry, you compete on convenience and price with everyone inside a ten minute drive, and your average new patient value tracks the low end of your fee schedule. If it says implants, or aligners, or full-mouth reconstruction, you compete on credibility, and your average new patient value tracks the procedure instead.
This is the part owners resist, because narrowing the signal feels like turning revenue away at the door. It works in the opposite direction. A clearer signal does not shrink your patient pool, it changes who arrives and what they arrive prepared to do. Reading dental marketing ROI at the case mix level is what converts a spend decision into a production decision. Run your own numbers by procedure category before the next renewal lands. The channel you were about to cut may simply be aimed at the wrong half of your schedule, and correcting the aim costs nothing except clarity about who you are for.
There is no line item for the patients who never found you. It shows up as a schedule with gaps you blame on the local economy.
How long before you can fairly judge a channel?
Longer than a month, shorter than a year. The lag between a patient finding you and that patient producing meaningful revenue is real and unavoidable: a consultation in March becomes a case presented in April, accepted in May, and collected across June and July. Judging at thirty days measures nothing but response speed, which is the layer you already decided not to trust.
Ninety days is the working window for most general practices. Cases with a longer clinical sequence, implants with grafting, ortho on a payment plan, need two full quarters before the figure stabilises. Your practice should set that window before the spend starts rather than after the invoice makes you anxious, because choosing the measurement period once you can already see the result is how owners talk themselves into keeping something that is not working.
The other half of patience is honesty about seasonality. Benefit resets, school calendars, and the fourth quarter use-it-or-lose-it rush will move your numbers further than any channel will. Compare a quarter to the same quarter last year, never to the one that just ended.
What is the cost of the patients who never reached you?
Return is not only what a dollar produced. It is also what your current position costs you every month you leave it untouched. The average solo practice leaves $147,000 in unrealised production on the table each year, according to The Dental Index national practice audit. That is not an abstraction about opportunity. That is a hygienist, a second chair, or the difference between selling your practice at a defensible multiple and selling it at a discount to someone who priced the gap before you did.
Seventy percent of practices are effectively invisible to AI-driven patient search, and average readiness sits below 40 out of 100. Your practice is statistically likely to be inside that seventy percent, not because you did anything wrong, but because nobody invoices you for the patients who never found you. There is no line item for absence. It shows up as a schedule with gaps you blame on the local economy, and as an EBITDA figure quietly running a third below the practice two miles away with identical clinical skill and a clearer signal.
Activity is not a result
Practices that solve this stop treating volume at the top as evidence of anything. They understand that a number can be true, rising, and completely irrelevant to what they take home at the same time. The question is never how many, it is how many became production.
The third layer is yours alone
Owners who close this gap accept that no outside party can measure revenue for them, because revenue lives inside their software and nowhere else. They stop waiting for a better report and start reading their own. The report they were waiting for was never capable of existing.
Narrowing is not shrinking
The practices that get the most from the same spend see clarity as an aim, not a restriction. Being specific about who you are for does not remove patients from the pool, it changes which ones arrive and what they arrive prepared to accept. Vagueness is the thing that costs, and it costs silently.
Absence has a price too
The uncomfortable recognition is that the largest cost in this whole calculation never generates an invoice. Practices that think clearly about return account for the patients who never found them alongside the money they spent, because both land in the same EBITDA line at the end of the year.
Why does the highest-intent demand show up as the smallest number?
Because the best traffic is the quietest traffic. Roughly 432,000 dental searches run through AI systems every month, and those systems do not send you a monthly report. There is no impression count, no follower graph, no summary telling you that you were named or skipped when a patient in your ZIP code asked which practice to trust with an implant. The patient either arrives already convinced, or never arrives at all.
Patients who reach a practice through that route book high-value treatment at two to three times the rate of other sources. Your practice experiences this as a handful of unusually well-prepared new patients who ask precise questions and accept treatment quickly, and you have no idea where they came from. Meanwhile 82% of local searches end in a Maps interaction, and a complete, well-structured profile earns roughly seven times the clicks of an incomplete one. The volume layer is loud and cheap to measure. The high-value layer is quiet and mostly unmeasured. Fund only what reports well and you will systematically starve the layer with the best production per dollar in your practice.
How do you decide what to fund and what to cut?
Rank every channel by production per dollar across your chosen window, then ask the second question the ranking cannot answer on its own: is this channel underperforming, or is it well built and aimed at the wrong thing? Cutting something that works fine but signals the wrong specialty is how practices end up rebuying the same capability eighteen months later at a higher price and calling it a fresh start.
Fund the layer that is genuinely broken. If reach is healthy and response is weak, your problem is what people encounter when they find you, not how many find you. If response is healthy and revenue is weak, your problem is case mix and case acceptance, and additional spend will not touch it. A working demand capture system is simply one where each layer is measured separately, so you can name which one is leaking instead of replacing all three.
Then hold the decision for a full window. The most expensive habit in solo ownership is not overspending, it is switching direction every sixty days so nothing ever runs long enough to prove itself either way.
Here is what the same spend looks like from either side of a positioning decision:
| What you are measuring | Practice with unclear positioning | Practice with clear positioning | What it means for your production |
|---|---|---|---|
| Visibility in AI-driven patient search | Inside the 70% not surfaced at all | Inside the 8% scoring above 65 on readiness | You are either named in the answer or absent from it, with no report either way |
| Maps profile completeness | Partial profile, baseline click volume | Complete profile, roughly 7x the clicks | 82% of local searches end in a Maps interaction, so this layer decides who calls |
| High-value treatment booking rate | Baseline, weighted toward exams and hygiene | 2-3x on high-value treatment from AI-referred patients | Same chair count, materially different production per chair hour |
| Annual unrealised production | Absorbs the $147K average without seeing it | Measures the gap and prices decisions against it | The cost of absence never appears on an invoice, only in your EBITDA |
Source: The Dental Index national practice audit · 2026
Rina stopped counting calls. She pulled ninety days of production by source instead. Two channels she had defended for a year produced almost nothing. One she had nearly cancelled produced most of her implant consultations. Her budget did not change by a dollar. Every decision she made after that did.
That is the whole exercise. Your return is not determined by how much you spend on being seen. It is determined by how clearly you are positioned at the moment the seeing happens, because that is what decides who shows up and what they show up ready to do. Clear positioning is what makes Google Maps ranking and AI search visibility work at all. An invisible position is an invisible practice, regardless of effort, regardless of spend.