Dental Demand in
Wake County, North Carolina.
Wake County is the #1 dental market in North Carolina — and one of the highest-demand counties in the United States. Patients here run an estimated 9,473 dental searches every month. This whitepaper maps where that demand is, what patients search for, and what it means if you're planning to own, expand, grow, or sell a practice in this market.
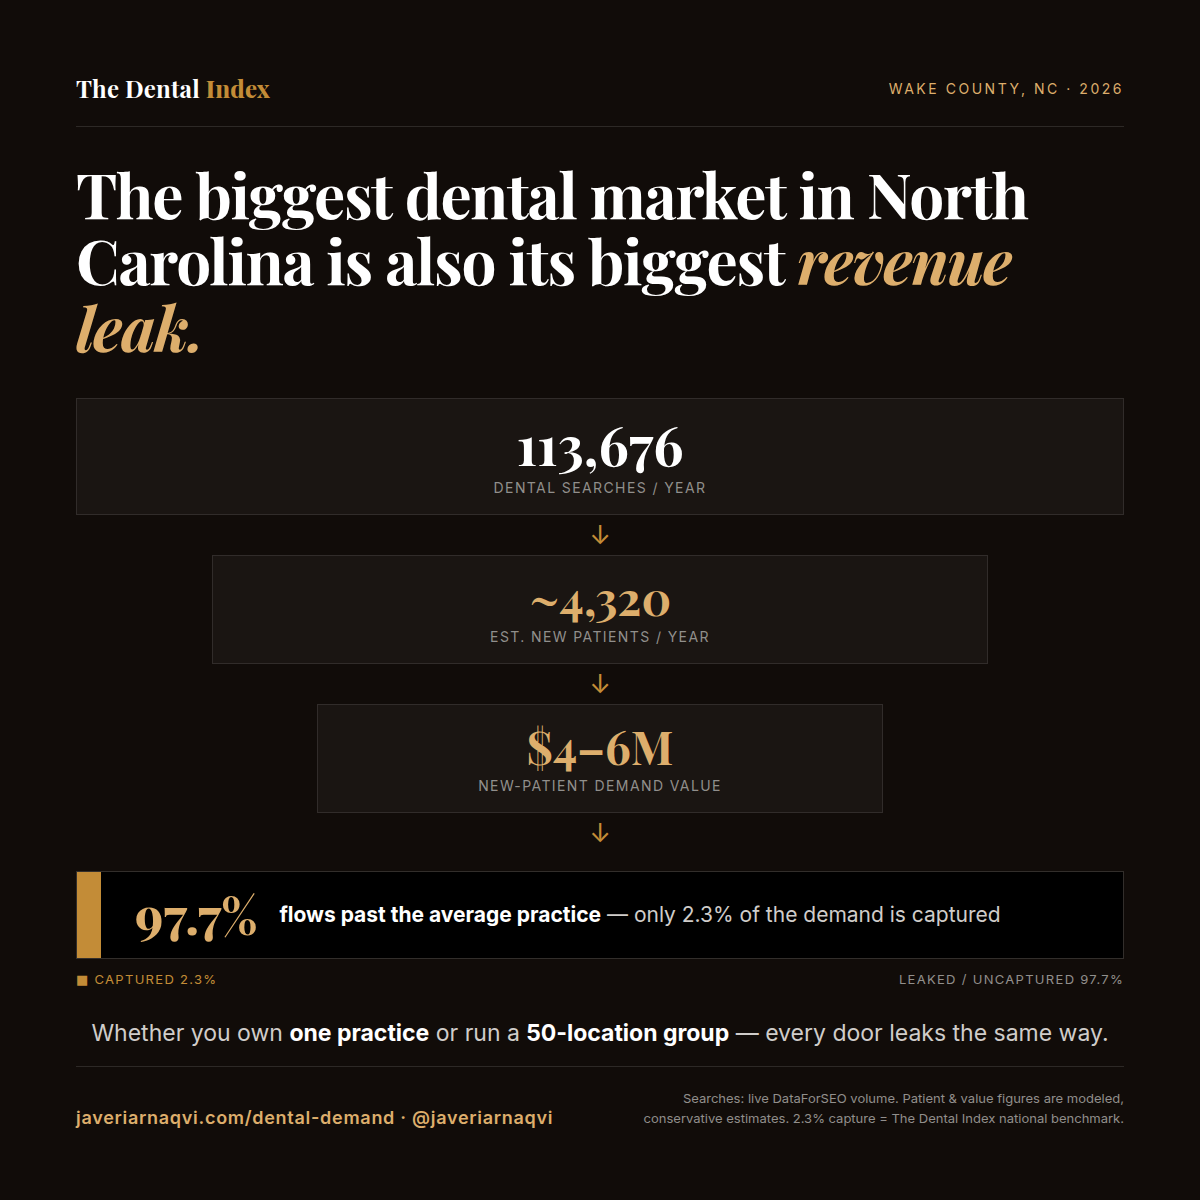
The biggest dental market in North Carolina is also its biggest revenue leak.
Conventional wisdom says the largest markets are too saturated to enter. Wake County is the opposite. It has more patient demand than any county in the state — and almost none of it is locked down. Search demand, not population or practice count, is the real map of dental opportunity. And in the richest market on that map, most of the money is sitting in plain sight, uncaptured.
Every figure here is deliberately conservative and tied to a live, measurable input. The 2.3% capture rate is a per-practice average (The Dental Index national benchmark), not a market-wide number — most demand is captured by the few most-visible practices. Swap in your own new-patient economics and the conclusion holds.
The Bottom Line,
Up Front.
Three things a decision-maker needs from Wake County. The detail — demand, supply, regional context, and the full own / expand / grow / sell read — follows below.
Where a Year of Demand
Actually Leaks.
One year of Wake County's dental demand, from search to revenue — and the gap every owner is leaving on the table.
You're competing for under 1% of the demand in your own backyard. Top-3 visibility in the two categories that drive 58% of it is the highest-ROI growth lever you have — no new chairs, no new ad spend, just being found for searches already happening.
Every location leaks the same way. One playbook across the footprint means the uncaptured demand compounds at each site — and so does the upside. Visibility is the rare lever you fix once, centrally, and capture everywhere.
Searches: live DataForSEO volume (9,473/mo × 12). Conversion (~3.8%) and new-patient value ($1,000–$1,500 each) are modeled, conservative estimates — search volume includes repeat and research queries, so the patient figure is directional, not a booking guarantee. The 2.3% average capture rate is The Dental Index national benchmark. Adjust any input to your own economics; the gap holds.
Patient Demand by
Service Category.
Not all dental demand is equal. In Wake County, a single category — General / Preventive — accounts for nearly half of all patient searches. Emergency and Orthodontics follow. The high-ticket categories practices most want (implants, cosmetic) sit in the middle of the demand curve, not the top.
| Service category | Monthly searches | Share | Relative demand |
|---|---|---|---|
| General / Preventive | 4,338 | 45.8% | |
| Emergency | 1,184 | 12.5% | |
| Orthodontics | 1,068 | 11.3% | |
| Pediatric Dentistry | 824 | 8.7% | |
| Implants | 774 | 8.2% | |
| Cosmetic | 765 | 8.1% | |
| Dentures | 338 | 3.6% | |
| TMJ / Jaw Pain | 182 | 1.9% |
"General / Preventive and Emergency together make up 58% of every dental search in Wake County. A practice's visibility in just these two categories decides most of its patient flow."
The Most-Searched
Dental Terms.
One keyword dominates everything: "dentist near me" alone draws an estimated 3,550 searches a month — more than every other term combined. After it, demand fragments quickly into service-specific intent.
General / Preventive3,550
Emergency586
Pediatric Dentistry390
Orthodontics390
Implants321
General / Preventive263
Orthodontics263
General / Preventive215
Cosmetic215
Cosmetic215
Emergency176
Orthodontics176
Top 12 of 48 keywords shown. Full keyword set available in the source audit.
How Much Competition
the Demand Supports.
Demand is only half the picture — supply is the other. Wake County's 9,473 monthly searches are spread across 59 practices that rank for dental terms, an average of roughly 160 searches per practice per month. But the market is top-heavy: the leading practices pull well above that average, while a long tail competes for what's left.
| Supply signal | Value | What it tells an owner |
|---|---|---|
| Practices ranking for dental terms | 59 | An established, competitive market — not a greenfield |
| Avg. monthly demand per practice | ~160 | Headroom exists; most demand is uncaptured |
| Largest single-practice share | <25% | No practice owns the market — it's winnable |
| Residents per ranking practice | ~19,900 | Population can support more visible supply |
Demand in Wake County is concentrated by category but fragmented by practice. The category that decides the most patient flow — General / Preventive — is not dominated by any single practice. In a market this size, visibility, not tenure, decides who wins it: a well-positioned practice can take share without out-spending the incumbents.
Where Wake Sits in
North Carolina.
For owners weighing a second location or a regional play, Wake is the benchmark — and only one other county comes close. The figures below rank North Carolina counties by discretionary-service demand (orthodontics, pediatric, and cosmetic — the growth categories), indexed against Wake.
| County | Metro | Population | Demand/mo | vs Wake |
|---|---|---|---|---|
| Wake | Raleigh–Cary | 1,175,021 | 2,657 | — |
| Mecklenburg | Charlotte | 1,145,392 | 2,592 | −2% |
| Guilford | Greensboro | 546,101 | 1,237 | −53% |
| Forsyth | Winston-Salem | 389,157 | 879 | −67% |
| Cumberland | Fayetteville | 336,699 | 763 | −71% |
| Durham | Durham | 332,680 | 751 | −72% |
Demand shown is for discretionary growth services (orthodontics, pediatric dentistry, cosmetic) — the categories used for expansion analysis — and differs from the 9,473 all-category figure. Top 6 of 100 NC counties shown.
"Only Charlotte's Mecklenburg County rivals Wake. Everything else in the state is less than half the size — which makes the Raleigh and Charlotte metros the two anchors of any North Carolina expansion plan."
Investment Signals.
Demand is the headline; these are the fundamentals underneath it — the conditions a buyer, lender, or DSO weighs before committing capital. Market fundamentals below are drawn from public data; the deal-diligence signals are compiled per-market in the full investment brief.
| Signal | Wake County, NC | Source |
|---|---|---|
| Population growth | ≈ +1.3% / yr · +25% over the 2010s — among the fastest-growing large counties in the US | U.S. Census |
| Median household income | ≈ $94,000 · roughly 20% above the US median | U.S. Census ACS |
| Dentist / practice density | 59 practices competing · North Carolina sits below the US average for dentists per capita | This report · ADA HPI |
| Search demand (current) | 9,473 / mo · #1 county in NC, +2,166% vs the state median | This report |
| Search demand trend (3-yr) | ● Full investment brief | DataForSEO historical |
| DSO penetration | ● Full investment brief | on request |
| Acquisitions (last 5 yrs) | ● Full investment brief | on request |
| Insurance / payer mix | ● Full investment brief | on request |
| Practice-density trend | ● Full investment brief | on request |
Public-data signals reflect the most recent U.S. Census and ADA Health Policy Institute figures and are indicative — verify against current sources in diligence. Deal-diligence signals (DSO penetration, M&A activity, payer mix, and multi-year trends) are sourced per-market and delivered in the full investment brief.
What This Means If You're
Planning Your Next Move.
| If you're planning to… | What this county's data says |
|---|---|
| Own / Buy | The #1-demand county in NC, yet no practice holds even a quarter of it. A buyer should price against captured demand and headroom — not just current production — and look for under-served categories (e.g., dentures) where supply trails demand. |
| Expand | Mecklenburg (Charlotte) is the only county that matches Wake; Guilford, Forsyth, Cumberland, and Durham form the next tier. A second location follows demand density, and these are the five markets that carry it. |
| Grow | 58% of all demand sits in General / Preventive and Emergency. Growth in this market comes from visibility in the high-volume categories — not from adding low-demand niche services. |
| Sell | A practice in the state's #1-demand county sits on a strong catchment story. The lever that lifts valuation is demonstrable captured demand plus visible headroom — both of which a market this large supports. |
Methodology &
Sources.
Keyword demand is sourced from live DataForSEO search-volume data for 48 dental service keywords, scaled to county population. Category totals aggregate the keywords within each of the 8 service categories. Supply is the count of distinct practices ranking for those keywords on Google Maps; demand-per-practice and concentration figures are derived from that count. Regional comparisons rank North Carolina counties by discretionary-service demand (orthodontics, pediatric, cosmetic), scaled to each county's population.
This is a county-level market report — it analyzes aggregate demand, supply, and regional context only. It does not name, rank, or audit individual practices. Search volumes and population figures reflect live data at the time of analysis (June 2026) and shift over time. Any patient or revenue conversions referenced elsewhere on The Dental Index are modeled estimates and labeled as such.
See the Demand
in Your County.
This is one county. We build these one market at a time. Request the whitepaper for your county and we'll map your market the same way — demand, supply, and the move that fits your goal.
Get Your County's Whitepaper →Free. Built from live DataForSEO + Google Maps data.