Dental Demand in
Camden County, New Jersey.
Camden County is a dense, affluent, mature dental market in South Jersey — #8 of 21 counties in New Jersey by patient demand, in a state that runs 26% more dentists per capita than the US average. Patients here run an estimated 4,227 dental searches every month across 114 competing practices. This whitepaper maps where that demand concentrates, what patients search for, and what it means if you're planning to own, expand, grow, or sell a practice in this market.
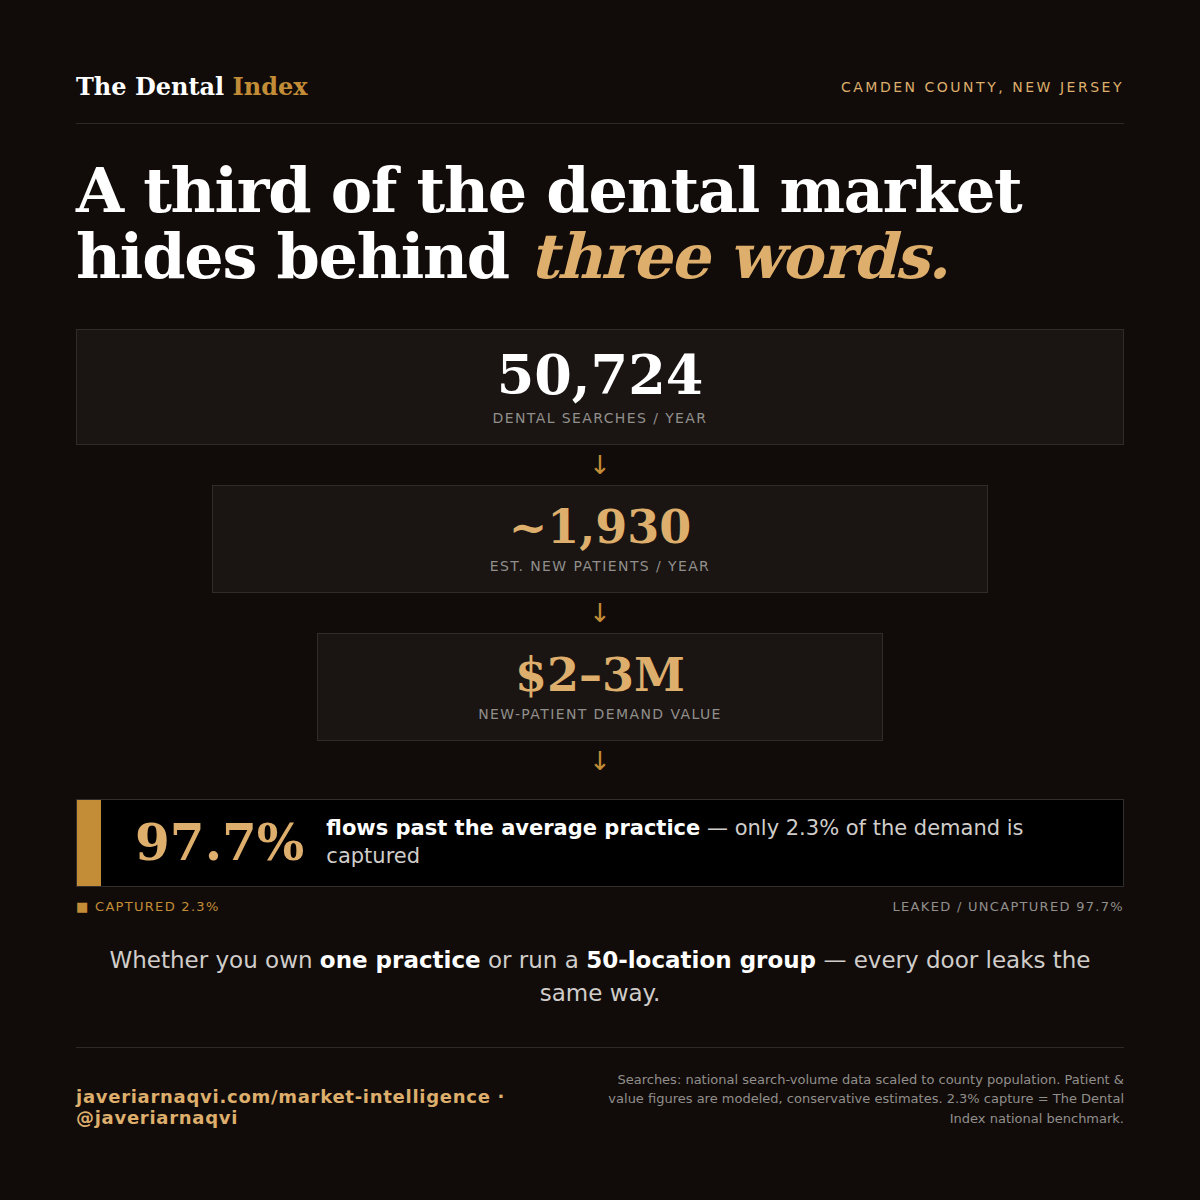
In Camden County, a third of the entire dental market hides behind three words.
Conventional wisdom says a dense, established market like Camden is closed to newcomers. The data says the opposite of closed — it says concentrated. Demand here doesn't spread out across 48 searches; it funnels. "Dentist near me" alone is 37.5% of every dental search in the county — yet the average practice still captures just 2.3% of the demand in front of it. In a market this concentrated, whoever owns the head term and the Map Pack it feeds owns the county.
Every figure here is deliberately conservative and tied to a live, measurable input. The 2.3% capture rate is a per-practice average (The Dental Index national benchmark), not a market-wide number — most demand is captured by the few most-visible practices. Swap in your own new-patient economics and the conclusion holds.
The Bottom Line,
Up Front.
Three things a decision-maker needs from Camden County. The detail — demand, supply, regional context, and the full own / expand / grow / sell read — follows below.
Where a Year of Demand
Actually Leaks.
One year of Camden County's dental demand, from search to revenue — and the gap every owner is leaving on the table.
Split evenly, the average practice here competes for under 1% of the demand in its own backyard. Top-3 visibility on the head term and the two categories that drive 58% of demand is the highest-ROI growth lever you have — no new chairs, no new ad spend, just being found for searches already happening.
Every location leaks the same way. One playbook across the footprint means the uncaptured demand compounds at each site — and so does the upside. Visibility is the rare lever you fix once, centrally, and capture everywhere.
Searches: national dental search-volume data scaled to Camden's population (4,227/mo × 12). Conversion (~3.8%) and new-patient value ($1,000–$1,500 each) are modeled, conservative estimates — search volume includes repeat and research queries, so the patient figure is directional, not a booking guarantee. The 2.3% average capture rate is The Dental Index national benchmark. Adjust any input to your own economics; the gap holds.
Patient Demand by
Service Category.
Not all dental demand is equal. In Camden County, a single category — General / Preventive — accounts for nearly half of all patient searches (46%). Emergency and Orthodontics follow. The high-ticket categories practices most want (implants, cosmetic) sit in the middle of the demand curve, not the top. This distribution mirrors the national pattern, scaled to Camden's population — which is precisely why the head categories, not the boutique ones, decide who wins the market.
| Service category | Monthly searches | Share | Relative demand |
|---|---|---|---|
| General / Preventive | 1,937 | 45.8% | |
| Emergency | 528 | 12.5% | |
| Orthodontics | 476 | 11.3% | |
| Pediatric Dentistry | 367 | 8.7% | |
| Implants | 346 | 8.2% | |
| Cosmetic | 342 | 8.1% | |
| Dentures | 150 | 3.5% | |
| TMJ / Jaw Pain | 81 | 1.9% |
"General / Preventive and Emergency together make up 58% of every dental search in Camden County — and a single term, 'dentist near me,' is 37.5% of the whole market. Visibility in the head term and these two categories decides most of a practice's patient flow."
The Most-Searched
Dental Terms.
One keyword dominates everything: "dentist near me" alone draws an estimated 1,586 searches a month — over a third of all dental demand in the county, and more than the next eleven terms put together. After it, demand fragments quickly into service-specific intent. That single term is the most valuable piece of real estate in the market.
General / Preventive1,586
Emergency262
Pediatric Dentistry174
Orthodontics174
Implants144
General / Preventive117
Orthodontics117
General / Preventive96
Cosmetic96
Cosmetic96
Emergency78
Orthodontics78
Top 12 of 48 keywords shown. Full keyword set available in the source audit.
How Much Competition
the Demand Supports.
Demand is only half the picture — supply is the other. Camden County's 4,227 monthly searches are spread across 114 practices that rank for dental terms — roughly 37 searches per practice per month if demand were split evenly. New Jersey runs about 26% more dentists per capita than the US average, and Camden shows it: this is a dense, established market, not a greenfield. It is also top-heavy — the top three practices already capture 44% of all ranked demand, while a long tail competes for what's left.
| Supply signal | Value | What it tells an owner |
|---|---|---|
| Practices ranking for dental terms | 114 | A dense, established market — NJ runs ~26% above the US dentist-per-capita rate |
| Avg. monthly demand per practice | ~37 | Thin per-practice demand — the head term is the prize |
| Largest single-practice share | ~20% | No practice owns the market, but the top tier is entrenched |
| Residents per ranking practice | ~4,600 | Dense supply — roughly 4× the practice density of a Sun Belt market |
Demand in Camden County is concentrated by category — and hyper-concentrated in one search — while supply is dense and the top tier is entrenched. In a market this crowded, the deciding edge isn't another chair or another location; it's out-ranking the field for the head term and the two categories that move 58% of demand. Visibility, not tenure or spend, is the only uncontested lever left.
Where Camden Sits in
New Jersey.
For owners weighing a second location or a regional play, Camden's position is nuanced. Every county that outranks it by demand sits in North Jersey, in New York City's orbit — a separate market with its own competitive set. Within its own South Jersey / Philadelphia-metro footprint, Camden is the anchor. The figures below rank New Jersey counties by discretionary-service demand (orthodontics, pediatric, and cosmetic — the growth categories), indexed against Camden.
| County | Metro | Population | Demand/mo | vs Camden |
|---|---|---|---|---|
| Bergen | North Jersey (NYC) | 952,997 | 2,152 | +82% |
| Middlesex | Central NJ (NYC) | 861,418 | 1,945 | +64% |
| Essex | Newark (NYC) | 849,477 | 1,918 | +62% |
| Camden | South Jersey (Philly) | 524,907 | 1,185 | — |
| Burlington | South Jersey (Philly) | 466,103 | 1,052 | −11% |
| Gloucester | South Jersey (Philly) | 302,294 | 683 | −42% |
Demand shown is for discretionary growth services (orthodontics, pediatric dentistry, cosmetic) — the categories used for expansion analysis — and differs from the 4,227 all-category figure. Populations are U.S. Census; under the tool's national-data model, demand scales with county population. 6 of 21 NJ counties shown.
"Every county that outranks Camden sits in North Jersey's New York orbit — a separate market. Within its own South Jersey footprint, Camden is the anchor, with Burlington and Gloucester trailing it. That makes the Camden–Cherry Hill core the natural hub of any Philadelphia-metro expansion."
Investment Signals.
Demand is the headline; these are the fundamentals underneath it — the conditions a buyer, lender, or DSO weighs before committing capital. Market fundamentals below are drawn from public data; the deal-diligence signals are compiled per-market in the full investment brief.
| Signal | Camden County, NJ | Source |
|---|---|---|
| Population growth | ≈ flat — +2% over the 2010s · a mature, built-out suburban county, not a high-growth Sun Belt market | U.S. Census |
| Median household income | ≈ $92,700 · well above the US median, below the NJ state median — an affluent, well-insured suburban catchment | U.S. Census ACS 2024 |
| Dentist / practice density | 114 practices competing · New Jersey runs ~26% above the US average for dentists per capita (≈75 vs 60 per 100k) | This report · ADA HPI |
| Search demand (current) | 4,227 / mo · #8 of 21 counties in NJ, +13% vs the state median | This report |
| Search demand trend (3-yr) | ● Full investment brief | DataForSEO historical |
| DSO penetration | ● Full investment brief | on request |
| Acquisitions (last 5 yrs) | ● Full investment brief | on request |
| Insurance / payer mix | ● Full investment brief | on request |
| Practice-density trend | ● Full investment brief | on request |
Public-data signals reflect the most recent U.S. Census and ADA Health Policy Institute figures and are indicative — verify against current sources in diligence. Deal-diligence signals (DSO penetration, M&A activity, payer mix, and multi-year trends) are sourced per-market and delivered in the full investment brief.
What This Means If You're
Planning Your Next Move.
| If you're planning to… | What this county's data says |
|---|---|
| Own / Buy | A mature, affluent, well-insured catchment (~$93K median income) with dense supply and no dominant owner — the leader holds only ~20%. Price against captured demand and headroom on the head term, not just current production. The fastest lever is Map Pack visibility on "dentist near me" and the two categories that carry 58% of demand — not adding niche service lines. |
| Expand | The North Jersey giants (Bergen, Middlesex, Essex) are larger but sit in a separate NYC-metro market. For a South Jersey / Philadelphia-metro footprint, Camden is the anchor and Burlington and Gloucester are the contiguous satellites — a tri-county cluster is the natural regional play. |
| Grow | 37.5% of all demand is a single search, and 58% sits in General / Preventive and Emergency. In a 114-practice field, growth is a visibility fight for the head term and the Map Pack it feeds — not a services-menu expansion. |
| Sell | An affluent, stable, high-insurance suburban catchment is the durable-cash-flow profile DSO and PE buyers pay up for. The valuation lever is demonstrable captured demand plus visible headroom on the head term — and because the field is dense but fragmented (leader ~20%), share is still gettable, which supports the growth story a buyer underwrites. |
Methodology &
Sources.
Keyword demand is estimated from national dental search-volume data for 48 service keywords, scaled to Camden County's population (524,907) — not live per-county DataForSEO; treat the volumes as directional and confirm with live data in diligence. Category totals aggregate the keywords within each of the 8 service categories. Supply is the count of distinct practices ranking for those keywords live on Google Maps (114); demand-per-practice and concentration figures are derived from that count. Regional comparisons rank New Jersey counties by discretionary-service demand (orthodontics, pediatric, cosmetic), scaled to each county's Census population.
This is a county-level market report — it analyzes aggregate demand, supply, and regional context only. It does not name, rank, or audit individual practices. Supply and population figures reflect data at the time of analysis (June 2026) and shift over time; Census and ADA figures are indicative — verify against current sources in diligence. Any patient or revenue conversions are modeled estimates and labeled as such. Read the full research methodology →
See the Demand
in Your County.
This is one county. We build these one market at a time. Request the whitepaper for your county and we'll map your market the same way — demand, supply, and the move that fits your goal.
Get Your County's Whitepaper →Free. Built from live DataForSEO + Google Maps data.