Ranked Almost Everywhere.
First Almost Nowhere.
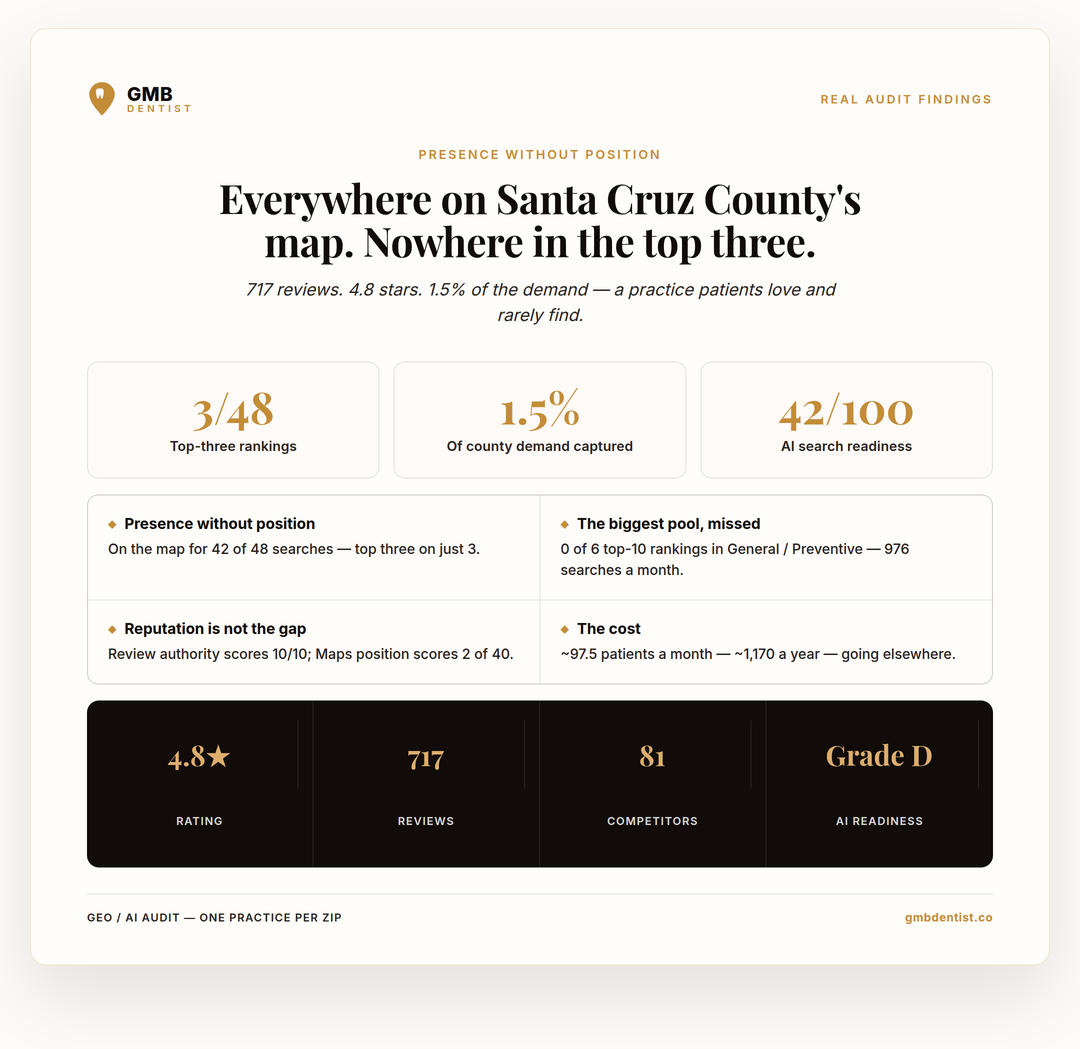
This practice is not hiding. It carries 717 Google reviews at 4.8 stars — far more than any competitor in its own threat matrix — and it appears somewhere in the Maps results for 42 of the 48 searches patients in its county actually make. And it captures 1.5% of that county's dental demand. Because appearing is not the same as being chosen: it holds a top-three position on just 3 of those 48 searches, and not one of them is a search the county makes often.
Present on Everything.
Chosen for Nothing.
The case studies before this one showed practices that were missing — unranked, invisible, absent from whole service categories. This practice is the opposite, and that makes it the more uncomfortable read. It is on the map for 42 of 48 high-intent dental searches. Only six searches return nothing at all. By the crude measure most practices use — "do we come up?" — it passes.
It still captures 33 of the 2,132 searches moving through its county every month. The reason is position. Patient clicks on Google Maps collapse into the top three results; everything below is a rounding error. This practice holds a top-three position on 3 of 48 searches — and its three are "toothache relief," "same day dentures," and "orthodontist." On "dentist near me," the single largest term in the county at 799 searches a month, it sits at #13. On "emergency dentist near me," #20.
"Showing up is not a ranking. A practice can be present on 42 searches and profitable on none of them, because patients only ever see three."
We call this pattern Presence Without Position — broad visibility with no competitive depth. It hides from every dashboard that reports coverage instead of rank. The table below pairs each service category with its total monthly demand, how much of that category the practice reaches the top ten for, and where it sits on that category's biggest search.
| Category | Demand/mo | Top-10 of 6 | Position on its top search | Read |
|---|---|---|---|---|
| General / Preventive | 976 | 0/6 | #13 | 46% of all county demand — and not one keyword in the top ten |
| Emergency | 266 | 1/6 | #20 | Urgent, high-conversion demand, effectively unreachable |
| Orthodontics | 241 | 3/6 | #3 | One of only three top-three positions in the whole audit |
| Pediatric Dentistry | 184 | 1/6 | #13 | Ranked on every children's term, competitive on none |
| Implants | 174 | 2/6 | #16 | Its highest-value service line sits deepest in the list |
| Cosmetic | 172 | 3/6 | #9 | Just outside the range that earns clicks |
| Dentures | 79 | 4/6 | #8 | Its strongest coverage — on its second-smallest demand pool |
| TMJ / Jaw Pain | 40 | 1/6 | #7 | Smallest pool in the county |
Demand is live DataForSEO monthly search volume for the category's six tracked keywords in this market. "Top-10 of 6" is how many of those six the practice reaches the top ten for. Position is its Google Maps rank on the category's highest-volume keyword. Green = top 3 · amber = 4–9 · red = 10+ or unranked.
The practice's best coverage — 4 of 6 in the top ten — sits on Dentures, a 79-search-a-month category. Its worst coverage — 0 of 6 — sits on General / Preventive, at 976 searches a month, 46% of everything its county searches for. Strong where demand is thin, absent where demand is thick. That inversion is the Demand Mismatch, and here it is running underneath the presence problem, not instead of it.
The Reviews Are
Not the Problem.
Most practices told they have a "visibility problem" reach for reviews. This one already won that fight. Break the 42/100 AI & Maps score into the five weighted components it is built from and the diagnosis is unambiguous: reputation is scoring full marks and position is scoring almost nothing.
| Score component | Weight | Scored | Lost | Read |
|---|---|---|---|---|
| Maps top-3 rankings | 40 | 2 | −38 | The entire deficit, in one line |
| Maps top-10 coverage | 25 | 8 | −17 | Ranked broadly, but mostly below ten |
| Service breadth | 20 | 18 | −2 | Nearly perfect — it offers and lists almost everything |
| Review authority | 10 | 10 | 0 | Full marks — 717 reviews |
| Rating signal | 5 | 4 | −1 | 4.8 stars |
Component weights are the audit's standard AI & Maps scoring model: Maps top-3 rankings 40%, top-10 coverage 25%, service breadth 20%, review authority 10%, rating signal 5%. Scored values are this practice's live results.
The practice is 58 points short of 100. Fifty-five of those points are Maps position — 38 from top-three rankings and 17 from top-ten coverage. Reputation costs it nothing at all, and breadth and rating cost it three points between them. There is no version of this problem that more reviews solve. The next review is worth zero points; the next top-three ranking is worth several.
Reviews Carry It Here.
Only So Far.
An estimated 18% of dental searches now run through AI engines before a patient ever opens Google Maps. This is the one place the practice's 717 reviews genuinely buy it something: on the engines that weight third-party reputation heavily — Perplexity, ChatGPT — it clears or approaches the visible threshold, the only two channels on this page where it does. On the engines that read Maps position and unclaimed listings, it falls straight back into the same hole.
Google AI Overviews — the single largest AI channel at 42% of AI dental searches — pulls directly from the local Map Pack. A practice sitting at #13 for "dentist near me" is not in the Map Pack, so it is not in the Overview either; the ranking gap simply reappears on a second channel. The two weakest engines, Bing Copilot and Siri / Apple Intelligence, draw on Bing Places and Apple Business Connect — listings most dental practices never claim, and the fastest points on this page to recover.
Across all six engines the audit models roughly 4.1 AI-referred patients available each month, of which this practice captures about 2.1 — a gap of around 2 patients/month (~24/year), growing an estimated 35% a year as AI search share rises. Small today. It is the only line on this page that compounds.
What Thirteenth Place
Costs.
Translate the uncaptured demand into patients and the scale of thirteenth place becomes visible. These are modeled estimates — they apply position-based click-through rates and category conversion assumptions to live search volume — but they size the opportunity. Across every category the practice competes in, the audit models roughly 97.5 patients a month, about 1,170 a year, going to competitors it already appears alongside.
| Category | Est. patients lost/mo | Modeled revenue/mo |
|---|---|---|
| General / Preventive | 48.6 | ~$13,600 |
| Emergency | 28.5 | ~$12,843 |
| Pediatric Dentistry | 8.3 | — |
| Cosmetic | 3.4 | — |
| All categories | 97.5 | — |
Revenue figures are modeled estimates based on category-specific conversion rates and an average case value; they are not booked revenue, and the audit models them for the two largest gaps only — those two alone come to roughly $26,400 a month, about $317,000 a year. No total across all eight categories is published because the audit does not calculate one. Patient-loss figures are CTR-adjusted from live Google Maps positions, consistent with the audit's Patient Gap Analysis, and cover categories the practice is already visible in.
Coverage Is Not
Competitiveness.
There is nothing wrong with this practice. Seven hundred and seventeen patients went out of their way to write about it, and 4.8 stars says most of them meant it. It offers nearly every service its market searches for — service breadth scores 18 of 20. If you asked the owner whether the practice shows up on Google, the honest answer would be yes, almost always, and they would be right.
That is exactly why it leaks. Busy doesn't mean profitable, and visible doesn't mean chosen. The practice is measuring the wrong thing — presence, which it has — instead of position, which it doesn't. Two competing listings hold the top three across almost every category in this county, and they hold them on a fraction of the reviews. The work is not more reputation. It is converting existing reputation into rank on the searches that carry the volume: the six General / Preventive terms where 46% of the county's demand sits and the practice reaches the top ten on zero of them, and the emergency terms where it sits at #20. That is what the Demand Capture System is built to do.
You can be on the map for almost every search in your county and still be chosen for almost none of them. Patients do not scroll to thirteenth place — and a reputation nobody reaches the top three with is a reputation you are funding your competitors with.
The Audit,
On One Card.
map. Nowhere in the top three.
Methodology &
Sources.
Rankings are pulled live from Google Maps across 48 dental service keywords — six in each of eight service categories — for this practice in its Santa Cruz County market. Search volumes are live DataForSEO data scaled to the local market. The AI & Maps score (42/100) weights Maps top-3 rankings (40%), top-10 coverage (25%), service breadth (20%), review authority (10%), and rating (5%); the component table above reports this practice's live result on each. AI engine scores are modeled estimates derived from Maps rank, review authority, and rating signals — not live queries to the AI engines. Patient and revenue figures are modeled from position-based click-through rates and category conversion assumptions, and are labeled as estimates throughout; the audit publishes modeled revenue for the two largest category gaps only, so no all-category total is shown.
The practice is anonymized, and so are its competitors; market context is reported at the county level. All figures reflect a current-state snapshot at the time of analysis (July 2026) and shift over time. This audit uses publicly observable data only and represents an independent assessment, not an engagement or a produced result. Read the full research methodology →
Find Out Where You
Actually Rank.
This is the same audit, run on your practice and your county. It maps local demand, scores your Maps and AI visibility, and shows exactly which searches you appear on but never win. Takes 2 minutes.
Free. No agency. Just the data on your market.