Dental Demand in
Denton County, Texas.
Denton County sits at the northern edge of the Dallas–Fort Worth metroplex — #7 of 254 counties in Texas by patient demand, and the fastest-growing county in this series, up 57% in population since 2010. Patients here run an estimated 7,879 dental searches every month across 124 ranking practices, in the wealthiest catchment we have mapped.
Denton County added 380,000 people. It added far fewer dentists.
Most counties in this series are contests over a fixed pool of patients. Denton is not. Its population grew 57.0% between 2010 and 2024 — from roughly 666,000 to over 1,045,000 — the fastest growth of any county we have mapped, ahead of Marion County, FL (+38%). Median household income is $108,185, narrowly the highest in the series, just ahead of Santa Cruz County, CA (~$105,000). That combination is rare: the demand base here is still being built, and it is being built by high-income households. Against it sit 124 ranking practices, one per 7,881 residents, and a leader holding 18.3% of the county’s demand.
Every figure here is deliberately conservative and tied to a live, measurable input. The 2.3% capture rate is a per-practice average (The Dental Index national benchmark), not a market-wide number — most demand is captured by the few most-visible practices. Swap in your own new-patient economics and the conclusion holds.
The Bottom Line,
Up Front.
Three things a decision-maker needs from Denton County. The detail — demand, supply, regional context, and the full own / expand / grow / sell read — follows below.
Where a Year of Demand
Actually Leaks.
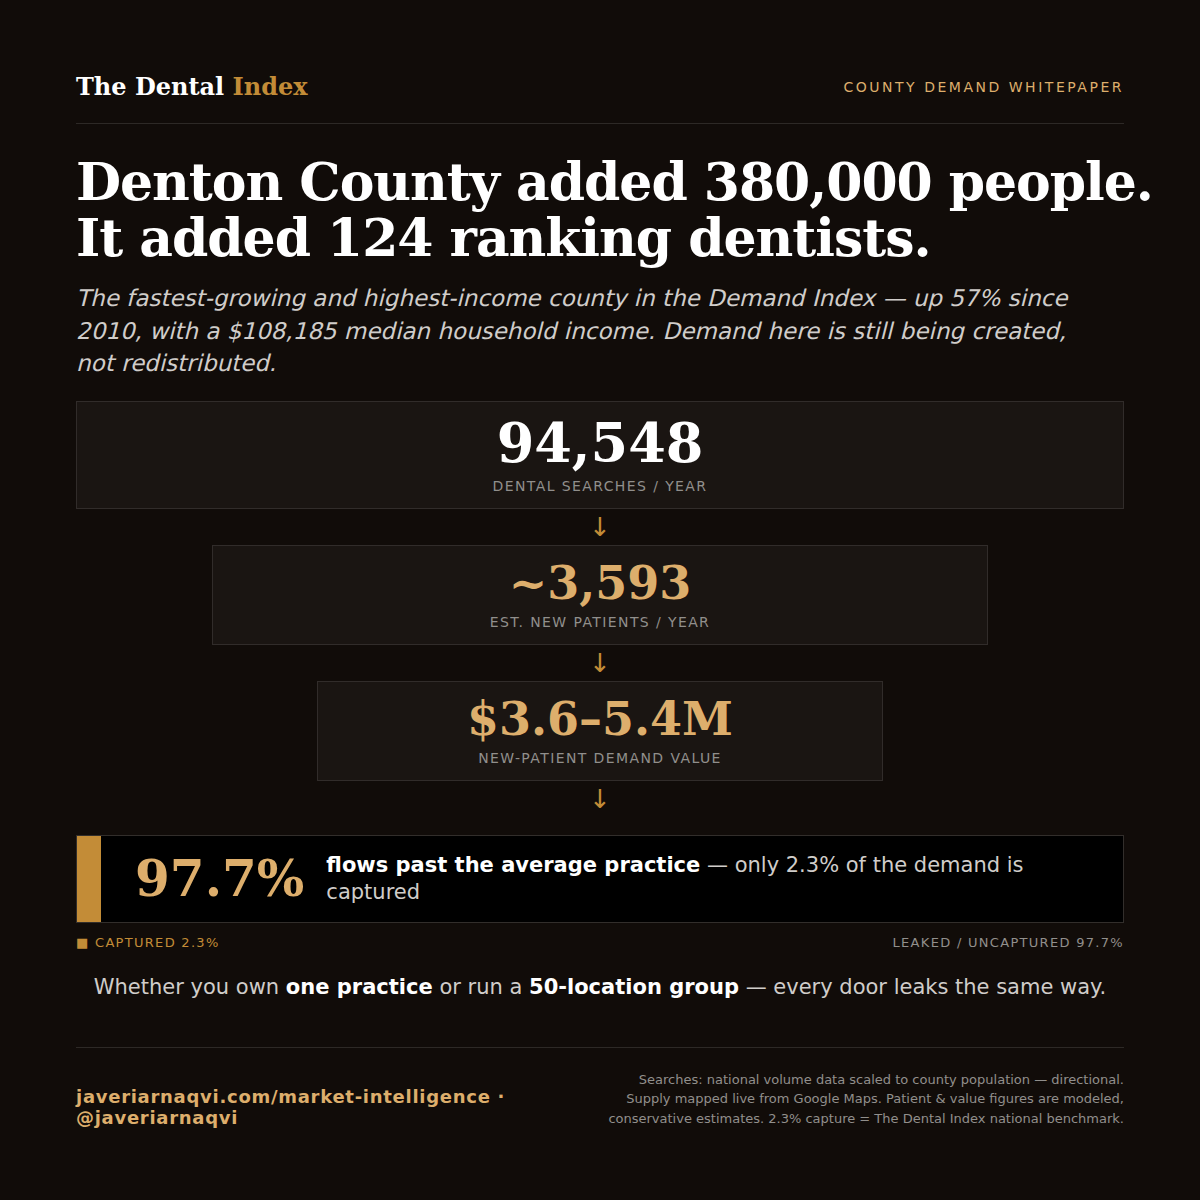
One year of Denton County's dental demand, from search to revenue — and the gap every owner is leaving on the table.
Split evenly, the average practice here competes for under 1% of the demand in its own backyard. Top-3 visibility on the head term and the two categories that drive 58% of demand is the highest-ROI growth lever you have — no new chairs, no new ad spend, just being found for searches already happening.
Every location leaks the same way. One playbook across the footprint means the uncaptured demand compounds at each site — and so does the upside. Visibility is the rare lever you fix once, centrally, and capture everywhere.
Searches: national dental search-volume data scaled to Denton County's population (7,879/mo × 12). Conversion (~3.8%) and new-patient value ($1,000–$1,500 each) are modeled, conservative estimates — search volume includes repeat and research queries, so the patient figure is directional, not a booking guarantee. The 2.3% average capture rate is The Dental Index national benchmark. Adjust any input to your own economics; the gap holds.
Patient Demand by
Service Category.
Not all dental demand is equal. In Denton County, General / Preventive accounts for 45.8% of all patient searches — 3,608 a month on its own. Emergency and Orthodontics follow. The high-ticket categories practices most want (implants, cosmetic) sit in the middle of the demand curve, not the top. This split is close to identical in every county we map, because category volumes are national search data scaled to population — treat it as the shape of dental demand generally, not as something distinctive about Denton. What is distinctive here is that the population underneath it grew 57% in fourteen years.
| Service category | Monthly searches | Share | Relative demand |
|---|---|---|---|
| General / Preventive | 3,608 | 45.8% | |
| Emergency | 984 | 12.5% | |
| Orthodontics | 888 | 11.3% | |
| Pediatric Dentistry | 686 | 8.7% | |
| Implants | 644 | 8.2% | |
| Cosmetic | 637 | 8.1% | |
| Dentures | 281 | 3.6% | |
| TMJ / Jaw Pain | 151 | 1.9% |
"General / Preventive and Emergency together are 58% of every dental search in Denton County — 4,592 searches a month. In a county adding roughly 27,000 residents a year, that base grows without anyone doing anything."
The Most-Searched
Dental Terms.
One keyword dominates: "dentist near me" draws an estimated 2,953 searches a month — more than the next eleven terms combined. Its ~37% share is a constant of the underlying national model, not a Denton trait, so it should not be read as unusual concentration. What matters locally is that this figure rises every year purely through in-migration.
General / Preventive2,953
Emergency487
Pediatric Dentistry325
Orthodontics325
Implants267
Orthodontics218
General / Preventive218
Cosmetic179
Cosmetic179
General / Preventive179
Emergency146
Orthodontics146
Top 12 of 48 keywords shown. Full keyword set available in the source audit.
How Much Competition
the Demand Supports.
Demand is only half the picture — supply is the other. Denton County's 7,879 monthly searches are spread across 124 practices that rank for dental terms — roughly 64 searches per practice per month if demand were split evenly. Against 977,281 residents that is one ranking practice per 7,881 people, mid-range for this series: thinner than Marion County, FL (5,357) but far denser than Harris County, TX (29,152). The distinguishing feature is not the ratio today but its direction — the denominator is growing faster here than anywhere else we have measured.
| Supply signal | Value | What it tells an owner |
|---|---|---|
| Practices ranking for dental terms | 124 | For a county that has added ~380,000 residents since 2010 |
| Avg. monthly demand per practice | ~64 | Mid-range for this series, and rising with in-migration |
| Largest single-practice share | 22.8% | Share of captured demand; 18.3% of all county demand |
| Residents per ranking practice | ~7,881 | Mid-range — and the numerator is growing 3.27% a year |
How the market actually divides.
Concentration is the question a buyer asks before demand is, and across Denton’s 124 ranking practices the answer is a cliff rather than a slope. Ranked by estimated monthly capture: the top three practices hold 45.7% of captured demand, capture nearly halves between the leader and the second practice, the leader captures roughly 15.8× what the fifteenth-placed practice does, and the 109 practices below the top fifteen split about 10 searches a month each. There is no gentle middle: a practice is either in the top three or it is in the tail. No practice is named — this is the shape of the market, which is the part that governs whether share is available.
The leader captures an estimated 1,438 searches a month — 22.8% of all captured demand and 18.3% of everything the county searches for. The top three hold 45.7% of captured demand. Capture nearly halves between the first practice and the second, and the leader captures 15.8× what the fifteenth-placed practice does. Below the top fifteen, the remaining 109 practices average about 10 searches a month each. The final column is those 109 combined, not a single practice.
Show the underlying figures
Show the underlying figures
| Practice (anonymized, by rank) | Est. searches / mo | Share of captured | Relative capture |
|---|---|---|---|
| #1 — market leader | 1,438 | 22.8% | |
| #2 | 790 | 12.5% | |
| #3 | 652 | 10.3% | |
| #4 | 453 | 7.2% | |
| #5 | 407 | 6.5% | |
| #6 | 259 | 4.1% | |
| #7 | 230 | 3.6% | |
| #8 | 218 | 3.5% | |
| #9 | 136 | 2.2% | |
| #10 | 133 | 2.1% | |
| #11 | 125 | 2.0% | |
| #12 | 106 | 1.7% | |
| #13 | 103 | 1.6% | |
| #14 | 97 | 1.5% | |
| #15 | 91 | 1.4% | |
| #16–#124 — the remaining 109 practices | ~1,069 | 17.0% |
Show the underlying figures
| Practice (anonymized, by rank) | Est. searches / mo | Share of captured | Relative capture |
|---|---|---|---|
| #1 — market leader | 9,136 | 26.4% | |
| #2 | 4,731 | 13.7% | |
| #3 | 3,261 | 9.4% | |
| #4 | 2,015 | 5.8% | |
| #5 | 1,721 | 5.0% | |
| #6 | 1,421 | 4.1% | |
| #7 | 1,284 | 3.7% | |
| #8 | 844 | 2.4% | |
| #9 | 647 | 1.9% | |
| #10 | 622 | 1.8% | |
| #11 | 498 | 1.4% | |
| #12 | 494 | 1.4% | |
| #13 | 443 | 1.3% | |
| #14 | 441 | 1.3% | |
| #15 | 430 | 1.2% | |
| #16–#154 — the remaining 139 practices | ~6,618 | 19.1% |
Estimated captures = keyword search volume × average click-through rate by Google Maps position, computed across the 48 service keywords for each of the 124 practices ranking in the county — the same model behind the audit’s competitor table. Captured demand totals ~25,432 of the county’s 7,879 monthly searches (67%); the remaining ~33% is captured by no practice. Shares are of captured demand, not of all county demand — the leader’s 22.2% here is 14.9% of everything the county searches for. The second-ranked practice’s value is reconstructed from the audit’s stated top-three share and its published share-of-capture chart, which agree to within 0.2%; every other value is printed in the audit. These are modeled estimates, not measured bookings: treat the distribution’s shape as decision-grade and individual values as directional. Practices are ranked but never identified; this is a county-level report.
Denton is a growth market in a series mostly made of share-shift markets. 124 practices, one per 7,881 residents, a leader at 18.3% of county demand, and a population compounding at 3.27% a year in the wealthiest catchment we have mapped. Share won here does not have to be taken from an incumbent; a meaningful part of it has not been claimed by anyone yet.
Where Denton Sits in
Texas.
Denton ranks #7 of all 254 Texas counties by dental demand, inside a Dallas–Fort Worth cluster that also holds Dallas (#2), Tarrant (#3) and Collin (#6). Its demand runs +5,188% above the Texas median county (~149 searches/mo) and +828% above the average US county (~849/mo). The ranking below is the order the audit measured across Texas; only Harris, Denton and Brazoria have been individually quantified in this series so far.
| County | Metro | TX rank | Demand/mo |
|---|---|---|---|
| Harris | Houston | #1 | 37,791 |
| Dallas | Dallas–Fort Worth | #2 | not measured this run |
| Tarrant | Dallas–Fort Worth | #3 | not measured this run |
| Bexar | San Antonio | #4 | not measured this run |
| Travis | Austin | #5 | not measured this run |
| Collin | Dallas–Fort Worth | #6 | not measured this run |
| Denton | Dallas–Fort Worth | #7 | 7,879 |
| Brazoria | Houston | #15 | 3,131 |
Rank order is the Texas county ranking measured in the source audit (top 20 of 254). Demand figures are all-category monthly searches; Harris’s and Brazoria’s are from their own separate county audits. Counties marked “not measured this run” were ranked but not individually quantified — no value is estimated for them here.
"Three of Texas's seven largest dental markets — Dallas, Tarrant and Collin — sit alongside Denton in one metroplex. Denton is the fastest-growing of them, which makes it the entry point where demand is still being created rather than redistributed."
Investment Signals.
Demand is the headline; these are the fundamentals underneath it — the conditions a buyer, lender, or DSO weighs before committing capital. Market fundamentals below are drawn from public data; the deal-diligence signals are compiled per-market in the full investment brief.
| Signal | Denton County, TX | Source |
|---|---|---|
| Population growth | +3.27% / yr · +57.0% over 2010–2024 — the fastest in this series, ahead of Marion County, FL (+38%) | U.S. Census |
| Median household income | $108,185 · the highest in this series, narrowly ahead of Santa Cruz County, CA (~$105,000) | U.S. Census ACS 2019–2023 5-yr |
| Dentist / practice density | 124 practices ranking · one per 7,881 residents · Texas runs below the US average for dentists per capita | This report · ADA HPI |
| Search demand (current) | 7,879 / mo · #7 of 254 counties in TX, +5,188% vs the state median county | This report |
| Search demand trend (3-yr) | ● Full investment brief | DataForSEO historical |
| DSO penetration | ● Full investment brief | on request |
| Acquisitions (last 5 yrs) | ● Full investment brief | on request |
| Insurance / payer mix | ● Full investment brief | on request |
| Practice-density trend | ● Full investment brief | on request |
Public-data signals reflect the most recent U.S. Census and ADA Health Policy Institute figures and are indicative — verify against current sources in diligence. Deal-diligence signals (DSO penetration, M&A activity, payer mix, and multi-year trends) are sourced per-market and delivered in the full investment brief.
What This Means If You're
Planning Your Next Move.
| If you're planning to… | What this county's data says |
|---|---|
| Own / Buy | A fast-growing, affluent, well-insured catchment ($108,185 median income — the highest in this series) where supply is mid-range and no one owns the market: the leader holds 22.8% of captured demand, 18.3% of all county demand. Price against captured demand, headroom on the head term, and the fact that the catchment itself is compounding at 3.27% a year — not just current production. The fastest lever is Map Pack visibility on "dentist near me" and the two categories that carry 58% of demand — not adding niche service lines. |
| Expand | The Dallas–Fort Worth metroplex holds four of Texas’s seven largest dental markets — Dallas (#2), Tarrant (#3), Collin (#6) and Denton (#7). Denton and Collin are the growth edges of it; Dallas and Tarrant are the mature cores. A north-metroplex footprint captures in-migration rather than competing for an established patient base. |
| Grow | 37.5% of all demand is a single search, and 58% sits in General / Preventive and Emergency. In a 114-practice field, growth is a visibility fight for the head term and the Map Pack it feeds — not a services-menu expansion. |
| Sell | An affluent, stable, high-insurance suburban catchment is the durable-cash-flow profile DSO and PE buyers pay up for. The valuation lever is demonstrable captured demand plus visible headroom on the head term — and because the field is dense but fragmented (leader ~20%), share is still gettable, which supports the growth story a buyer underwrites. |
Methodology &
Sources.
Keyword demand is estimated from national dental search-volume data for 48 service keywords, scaled to Denton County's population (977,281) — not live per-county DataForSEO; treat the volumes as directional and confirm with live data in diligence. Two population vintages appear in this report and are not interchangeable: the audit engine scales demand to 977,281, the figure current when the market was analyzed, and every supply-density figure here (demand and residents per practice) is computed on that same basis so the ratios stay internally consistent. The Census 2024 vintage estimate of roughly 1,045,000 is used only in the growth story, where the point is the trajectory rather than the level. On the newer figure the county runs closer to one ranking practice per 8,400 residents — thinner still, and moving in the direction the thesis describes. Because volumes are scaled from one national model, the category shares and each keyword's share of the market are near-identical in every county we publish — they describe dental demand generally, not Denton specifically. The genuinely county-specific figures here are the ones drawn from live Google Maps and the U.S. Census: the practice count, demand and residents per practice, market-share splits, state rank, income and population growth. Category totals aggregate the keywords within each of the 8 service categories. Supply is the count of distinct practices ranking for those keywords live on Google Maps (124); demand-per-practice and concentration figures are derived from that count. Market-share figures are shares of captured demand unless explicitly stated as a share of all county demand. Regional comparisons use the Texas county demand ranking measured in the source audit.
This is a county-level market report — it analyzes aggregate demand, supply, and regional context only. It does not name, rank, or audit individual practices. Supply and population figures reflect data at the time of analysis (June 2026) and shift over time; Census and ADA figures are indicative — verify against current sources in diligence. Any patient or revenue conversions are modeled estimates and labeled as such. Read the full research methodology →
Operating More Than
One Location Here?
This report is built by the same engine I run for consulting clients. For dental groups, multi-location practices, and DSOs, I turn it on your markets: Maps + AI-engine visibility scoring for every location, competitor threat maps, keyword-level patient-loss quantification, and a 90-day roadmap. The AI Visibility Diagnostic is scoped per market and credited toward any engagement.
See the Demand
in Your County.
This is one county. We build these one market at a time. Request the whitepaper for your county and we'll map your market the same way — demand, supply, and the move that fits your goal.
Get Your County's Whitepaper →Free. Built from live DataForSEO + Google Maps data.