Dental Demand in
Marion County, Florida.
Marion County — Ocala and the surrounding horse country — is a fast-growing North Central Florida market with an unusually old population: #19 of 67 counties in Florida by patient demand, and 173% above the state's median county. Patients here run an estimated 3,684 dental searches every month, split across 74 competing practices. This whitepaper maps where that demand concentrates, why the county's age structure means the model understates its most valuable categories, and what it means if you're planning to own, expand, grow, or sell a practice in this market.
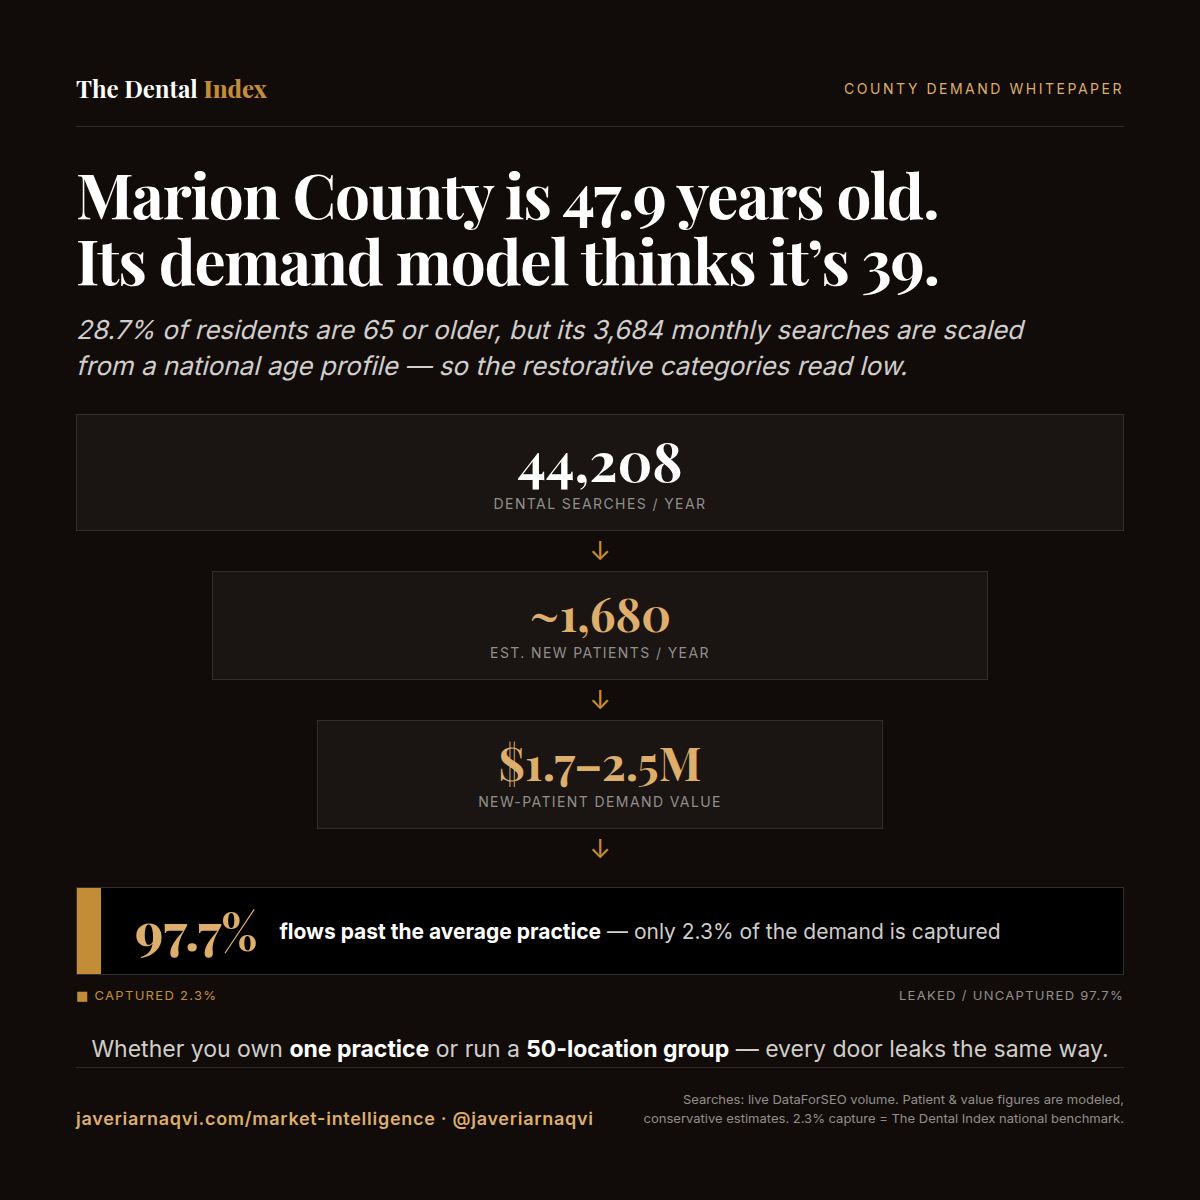
Marion County is 47.9 years old. Its demand model thinks it's 39.
On the surface Marion reads as a healthy mid-major market: 3,684 dental searches a month, 173% above the median Florida county, spread across 74 ranking practices — roughly 50 searches per practice per month, the second-highest per-practice demand in this report series behind only Wake County, NC. But the number that should change how you read every category below is demographic. 28.7% of Marion residents are 65 or older and the median age is 47.9, against roughly 18% and 39 nationally. Keyword volumes in this model are national search behaviour scaled to county population — so it prices Marion as if it were demographically average. It is not. The categories it is most likely to understate here are implants, dentures and full-arch restorative — the highest-value work in dentistry, in the county most likely to need it.
Every figure here is deliberately conservative and tied to a live, measurable input. The 2.3% capture rate is a per-practice average (The Dental Index national benchmark), not a market-wide number — most demand is captured by the few most-visible practices. Swap in your own new-patient economics and the conclusion holds.
The Bottom Line,
Up Front.
Three things a decision-maker needs from Marion County. The detail — demand, supply, regional context, and the full own / expand / grow / sell read — follows below.
Where a Year of Demand
Actually Leaks.
One year of Marion County's dental demand, from search to revenue — and the gap every owner is leaving on the table.
Split evenly, the average practice here competes for about 1.4% of the demand in its own backyard — roughly 50 searches a month, nearly double what a practice in Camden County, NJ competes for. That headroom is real, and it is concentrated: “dentist near me” alone is 43% of the entire county market. Top-3 Maps visibility on that one term, plus emergency, moves more new patients here than any service-line addition.
Every location leaks the same way. One playbook across the footprint means the uncaptured demand compounds at each site — and so does the upside. Visibility is the rare lever you fix once, centrally, and capture everywhere.
Searches: national dental search-volume data scaled to Marion County's population (3,684/mo × 12). Conversion (~3.8%) and new-patient value ($1,000–$1,500 each) are modeled, conservative estimates — search volume includes repeat and research queries, so the patient figure is directional, not a booking guarantee. The 2.3% average capture rate is The Dental Index national benchmark. Adjust any input to your own economics; the gap holds.
Patient Demand by
Service Category.
Not all dental demand is equal. In Marion County a single category — General / Preventive — accounts for just over half of all patient searches (50.6%), with Emergency, Orthodontics and Pediatric clustered behind it. Read the bottom of this table with the county's age structure in mind: the model puts Pediatric Dentistry at 338 searches a month and Dentures at 114 — pediatric outdrawing dentures three to one in a county where more than one resident in four is past 65. That ratio is an artifact of applying a national age profile to an unusually old county, not a finding about Marion. Treat the restorative rows as a floor, and test them against your own chair-time data before sizing the opportunity.
| Service category | Monthly searches | Share | Relative demand |
|---|---|---|---|
| General / Preventive | 1,865 | 50.6% | |
| Emergency | 400 | 10.9% | |
| Orthodontics | 369 | 10.0% | |
| Pediatric Dentistry | 338 | 9.2% | |
| Cosmetic | 275 | 7.5% | |
| Implants | 261 | 7.1% | |
| Dentures | 114 | 3.1% | |
| TMJ / Jaw Pain | 62 | 1.7% |
"General / Preventive and Emergency together are 2,265 of Marion County's 3,684 monthly searches — 61% of the market. But the model that produces those shares assumes a national age profile, and Marion is a decade older than the country. In a county this old, the restorative rows are the ones worth verifying rather than accepting."
The Most-Searched
Dental Terms.
One keyword dominates everything: "dentist near me" alone draws an estimated 1,600 searches a month — 43% of all dental demand in the county, and more than the next forty-seven terms combined. After it, demand fragments fast: the second-largest term is worth 198 searches, and by the twelfth it is down to 59. Across a 74-practice field, that single term is the most valuable piece of real estate in Marion County by a wide margin, and it is won or lost in the Google Maps three-pack.
General / Preventive1,600
Emergency198
Pediatric Dentistry140
Orthodontics140
Implants108
Pediatric Dentistry90
General / Preventive89
Orthodontics89
Cosmetic72
Cosmetic72
General / Preventive72
Emergency59
Top 12 of 48 keywords shown. Full keyword set available in the source audit.
How Much Competition
the Demand Supports.
Demand is only half the picture — supply is the other, and Marion is the most favourable supply environment in this series after Wake County, NC. The county's 3,684 monthly searches are spread across 74 practices that rank for dental terms — roughly 50 searches per practice per month if demand were split evenly. That is one ranking practice for every ~5,400 residents: supply density close to Camden County, NJ's ~4,600, but with about 35% more demand behind each practice, and well short of the ~3,350 in Santa Cruz County, CA. The field is only moderately top-heavy — the top three practices hold 45.8% of demand that is captured at all, while the single leader takes an estimated 15.8% of all county demand (19.9% of captured demand).
| Supply signal | Value | What it tells an owner |
|---|---|---|
| Practices ranking for dental terms | 74 | An established but not crowded field for a county of 396,415 |
| Avg. monthly demand per practice | ~50 | Second-highest per-practice demand in this series — genuine headroom, not a zero-sum fight |
| Largest single-practice share | 15.8% | Share of all county demand — no practice owns Marion (19.9% of captured demand) |
| Residents per ranking practice | ~5,400 | Moderate catchment — denser than Wake County, NC, looser than Camden County, NJ |
How the market actually divides.
Concentration is the question a buyer asks before demand is. Ranked by estimated monthly capture, Marion’s field falls away fast: the top three practices hold 45.8% of all captured demand, the leader captures roughly 19× what the fifteenth-placed practice does, and the 59 practices below the top fifteen split about four searches a month each. Twenty-two of the 74 capture nothing measurable at all. No practice is named — this is the shape of the market, which is the part that governs whether share is available.
The top three practices hold 45.8% of all captured demand. Below the fifteenth the field flattens: the remaining 59 practices capture about four searches a month each, and 22 of the 74 capture nothing measurable at all. The final column is those 59 combined, not a single practice.
Show the underlying figures
| Practice (anonymized, by rank) | Est. searches / mo | Share of captured | Relative capture |
|---|---|---|---|
| #1 — market leader | 582 | 19.9% | |
| #2 | 443 | 15.2% | |
| #3 | 312 | 10.7% | |
| #4 | 214 | 7.3% | |
| #5 | 176 | 6.0% | |
| #6 | 162 | 5.5% | |
| #7 | 152 | 5.2% | |
| #8 | 112 | 3.8% | |
| #9 | 107 | 3.7% | |
| #10 | 102 | 3.5% | |
| #11 | 96 | 3.3% | |
| #12 | 73 | 2.5% | |
| #13 | 60 | 2.1% | |
| #14 | 49 | 1.7% | |
| #15 | 30 | 1.0% | |
| #16–#74 — the remaining 59 practices | ~249 | 8.5% |
Estimated captures = keyword search volume × average click-through rate by Google Maps position, computed across all 48 service keywords for each of the 74 practices ranking in the county — the same model behind the audit’s competitor table. Captured demand totals ~2,919 of the county’s 3,684 monthly searches (79%); the remaining ~21% is captured by no practice. Shares are of captured demand, not of all county demand — the leader’s 19.9% here is 15.8% of everything the county searches for. These are modeled estimates, not measured bookings: treat the distribution’s shape as decision-grade and individual values as directional. Practices are ranked but never identified; this is a county-level report.
"The tail is the finding. Fifty-nine practices in Marion County are competing over about four searches a month each, and twenty-two capture nothing at all. Whichever of them becomes consistently visible is not taking share from the leader — it is stepping out of the tail entirely."
Marion County is under-supplied relative to its demand, and growing into more of it. At ~50 searches per practice per month against a population that has grown roughly 38% since 2010, this is not a zero-sum field — the leader captures 15.8% of county demand, which means the large majority is still moving past every practice in the market. The constraint here is visibility on a single head term rather than saturation: “dentist near me” is 43% of the county, and 74 practices are competing to be one of the three listings that answer it.
Where Marion Sits in
Florida.
For owners weighing a second location, Marion sits in an unusually workable position: it is the anchor of North Central Florida, roughly 40 miles from Gainesville, 35 from The Villages, and 80 from Orlando. Lake County, directly southeast along the US-441 retirement corridor, carries discretionary demand within 4% of Marion's own — a genuine peer market rather than a step down, and the natural first move for a second location. The figures below rank nearby Florida counties by discretionary-service demand (orthodontics, cosmetic, and dentures — the growth categories used for expansion analysis), indexed against Marion.
| County | Metro / corridor | Population | Demand/mo | vs Marion |
|---|---|---|---|---|
| Orange | Orlando metro | ~1,471,900 | 2,815 | +271% |
| Volusia | Daytona / Deltona | ~579,600 | 1,108 | +46% |
| Lake | US-441 retirement corridor | ~412,900 | 790 | +4% |
| Marion | Ocala / North Central FL | 396,415 | 758 | — |
| Alachua | Gainesville | ~285,500 | 546 | −28% |
| Citrus | Nature Coast | ~162,500 | 311 | −59% |
| Sumter | The Villages | ~143,400 | 274 | −64% |
Demand shown is for discretionary growth services (orthodontics, cosmetic, dentures) — the categories used for this county's expansion analysis — and differs from the 3,684 all-category figure. Marion's population and demand are from the source audit; all other counties are U.S. Census ACS estimates, marked “~” and indicative — verify in diligence. Under the tool's national-data model, demand scales with county population, so neighbouring-county demand is derived from Marion's per-capita rate rather than separately audited. Note that this scaling assumes a national age profile, which understates restorative demand in the older counties here (Marion, Citrus, Sumter). 7 of 67 FL counties shown.
"Marion is the only county in this corridor with a true peer next door. Lake sits within 4% of its discretionary demand and shares the same retiree in-migration — which makes a second location there an extension of the same catchment, not a new market to learn. Orlando is three times the demand and a different fight entirely."
Investment Signals.
Demand is the headline; these are the fundamentals underneath it — the conditions a buyer, lender, or DSO weighs before committing capital. Market fundamentals below are drawn from public data; the deal-diligence signals are compiled per-market in the full investment brief.
| Signal | Marion County, FL | Source |
|---|---|---|
| Population growth | ≈ +38% since 2010 · 331,341 at the 2010 Census against ~400,000 today, and roughly +3.3% in the last year alone — sustained retiree and Sun Belt in-migration — indicative, confirm in diligence | U.S. Census · this report |
| Median household income | ≈ $61K · below the US median — a value-sensitive catchment for elective and cosmetic work, though the 65+ cohort brings retirement assets and Medicare Advantage dental riders — indicative, confirm in diligence | U.S. Census ACS |
| Age structure | 28.7% aged 65+ · median age 47.9 against ~39 nationally — the single most important variable in this market, and the one the demand model does not account for — indicative, confirm in diligence | U.S. Census QuickFacts |
| Dentist / practice density | 74 practices competing · ~5,400 residents each · Florida counted 12,350 dentists in 2023, roughly 55 per 100,000 residents — at or modestly below the US rate | This report · ADA HPI |
| Search demand (current) | 3,684 / mo · #19 of 67 counties in FL, +173% vs the state median county | This report |
| Search demand trend (3-yr) | ● Full investment brief | DataForSEO historical |
| DSO penetration | ● Full investment brief | on request |
| Acquisitions (last 5 yrs) | ● Full investment brief | on request |
| Insurance / payer mix | ● Full investment brief | on request |
| Practice-density trend | ● Full investment brief | on request |
Public-data signals reflect the most recent U.S. Census and ADA Health Policy Institute figures and are indicative — verify against current sources in diligence. Deal-diligence signals (DSO penetration, M&A activity, payer mix, and multi-year trends) are sourced per-market and delivered in the full investment brief.
What This Means If You're
Planning Your Next Move.
| If you're planning to… | What this county's data says |
|---|---|
| Own / Buy | A growing, value-sensitive retiree catchment with more demand per competitor than any county in this series except Wake. Underwrite on captured demand rather than county demand — but note the headroom is real here: the leader holds only 15.8% of what the county searches for. The fastest lever post-close is Map Pack position on "dentist near me" (1,600 searches a month, 43% of the entire county) and the Emergency category behind it. In diligence, pull the target's actual restorative case mix — in a county 28.7% aged 65+, the model's 114 monthly denture searches and 261 implant searches are almost certainly a floor, and that gap is where the case value hides. |
| Expand | Marion has the rare advantage of a peer market next door. Lake County carries discretionary demand within 4% of Marion's own (790/mo vs 758) and shares the same US-441 retiree corridor — the same patient, the same service mix, a catchment you already understand. Volusia (+46%) is the larger step east. Orlando (Orange, +271%) is three times the demand but a metro fight against far deeper incumbents. Within Marion itself, a second Ocala location is defensible — at ~50 searches per practice there is room — but the corridor play compounds faster. |
| Grow | Two things at once. For volume, 61% of demand is General / Preventive and Emergency and one term is 43% of the market — that is a Maps visibility problem, not a service-line problem. For case value, the model's restorative figures deserve a live test rather than acceptance: implants (261/mo) and dentures (114/mo) are scaled from a national age profile in a county a decade older than the country. Run a live keyword pull and check your own consult mix before concluding full-arch demand here is thin. |
| Sell | The story a buyer will pay for here is trajectory plus fragmentation: a county that has grown roughly 38% since 2010, with no practice holding more than 15.8% of demand. That combination underwrites headroom, which is the opposite of the pitch a saturated market allows. The valuation lever is demonstrable capture — documented Map Pack position on the head term and a restorative case mix you can evidence — because in a retiree county the acquirer is buying the 65+ pipeline, and that is the number they will diligence hardest. |
Methodology &
Sources.
Keyword demand is estimated from national dental search-volume data for 48 service keywords, scaled to Marion County's population (396,415) — not live per-county DataForSEO; treat the volumes as directional and confirm with live data in diligence. Because volumes are population-scaled, per-capita demand and the category shares are constant by construction across counties and are not findings about Marion. This matters more here than in most counties: the scaling applies a national age profile to a county where 28.7% of residents are 65 or older, so restorative categories (implants, dentures) are likely understated and pediatric and orthodontic categories likely overstated. The age-structure caveat in this report is an inference from Census demographics against the model's construction, not a measured local search figure — verify with a live keyword pull in diligence. Category totals aggregate the keywords within each of the 8 service categories. Supply is the count of distinct practices ranking for those keywords live on Google Maps (74); demand-per-practice, concentration, and residents-per-practice figures are derived from that count and are the load-bearing comparisons in this report. Market-share figures distinguish two things: the leader's 15.8% is its share of all county demand, while the leader's 19.9% and the top-three 45.8% are shares of captured demand only. Regional comparisons rank Florida counties by discretionary-service demand (orthodontics, cosmetic, dentures), scaled to each county's population.
This is a county-level market report — it analyzes aggregate demand, supply, and regional context only. It does not name, rank, or audit individual practices. Supply and population figures reflect data at the time of analysis (July 2026) and shift over time; Census and ADA figures are indicative — verify against current sources in diligence. Any patient or revenue conversions are modeled estimates and labeled as such. Read the full research methodology →
Operating More Than
One Location Here?
This report is built by the same engine I run for consulting clients. For dental groups, multi-location practices, and DSOs, I turn it on your markets: Maps + AI-engine visibility scoring for every location, competitor threat maps, keyword-level patient-loss quantification, and a 90-day roadmap. The AI Visibility Diagnostic is scoped per market and credited toward any engagement.
See the Demand
in Your County.
This is one county. We build these one market at a time. Request the whitepaper for your county and we'll map your market the same way — demand, supply, and the move that fits your goal.
Get Your County's Whitepaper →Free. Built from live DataForSEO + Google Maps data.